Bar Charts With Julia
I was writing a new article for Merit and I wanted to make some charts and graphs. I used to use gnu octave for my data analysis needs but recently saw a tweet from Grady Booch about trying Julia which has a matlab esque sytnax. However, it being like matlab is definately at a superficial level because Julia is type safe and seems to use LLVM to precompile your code to get some pretty nice performance.
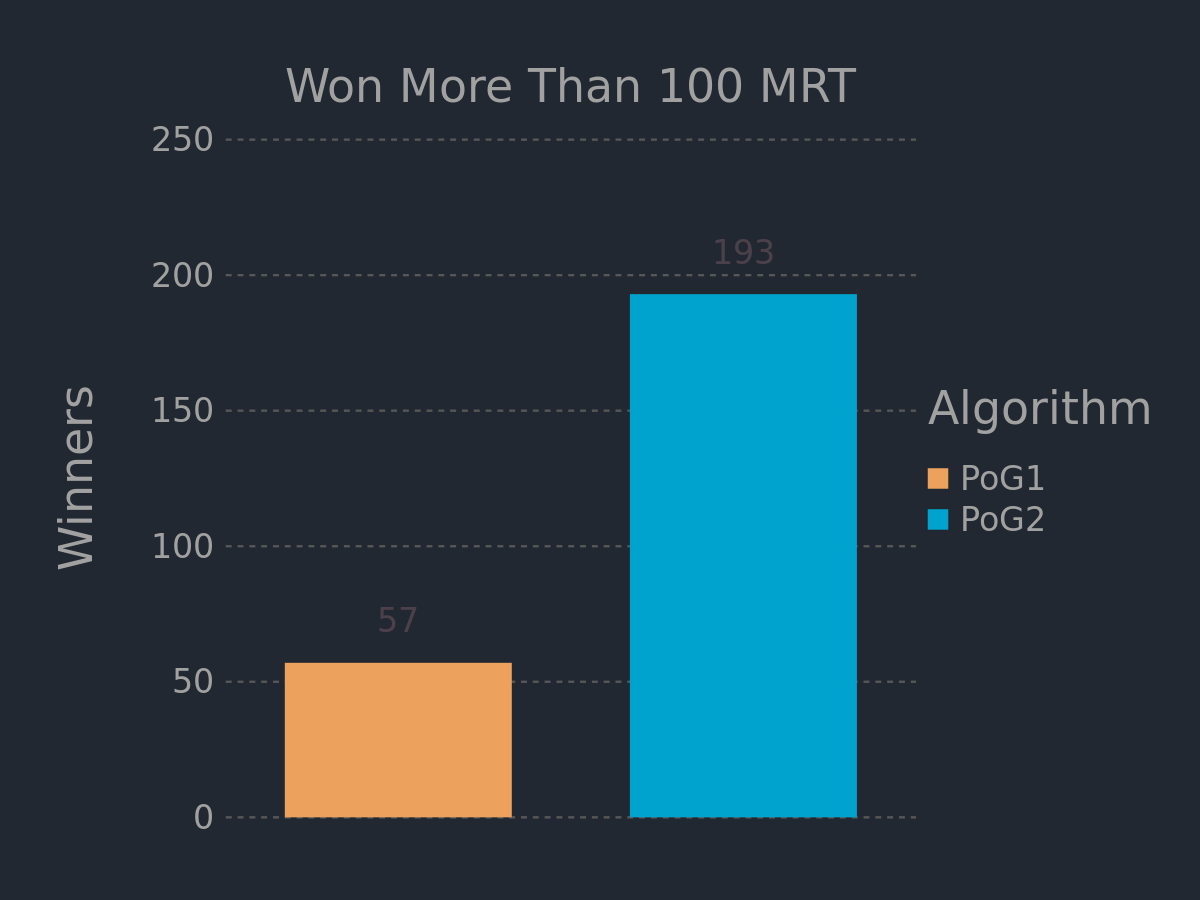
Julia has many nice graphing libraries but I couldn’t find any good tutorials on how to generate a bar chart with Julia. I decided on using Gadfly for charts because it seemed to have some nice documentation and nice looking charts. I ended up making a bar chart that looks like this.

I think the end result is really nice and it was easy to optimize it to look nice on a mobile device. The code for the chart above is
[code language=”matlab”]
using Gadfly
using DataFrames
using Colors
using CSV
Gadfly.push_theme(:dark)
function merit_colors(n)
cs = distinguishable_colors(
n,
[colorant”#eca25c”, colorant”#00a3cd”], # seed colors
lchoices=Float64\[58, 45, 72.5, 90\], # lightness choices
transform=c -> deuteranopic(c, 0.1), # color transform
cchoices=Float64[20,40], # chroma choices
hchoices=[75,51,35,120,180,210,270,310] # hue choices)
convert(Vector{Color}, cs)
end
d100 = DataFrame(
Winners = [57, 193],
Maxes = [250, 250],
Ls = [“57”, “193”],
Algorithm=[“PoG1″,”PoG2″])
p100 = plot(
d100,
x=:Algorithm,
y=:Winners,
ymax=:Maxes,
color=:Algorithm,
style(bar_spacing=1cm),
label=”Ls”,
Geom.bar(position=:dodge),
Geom.label(position=:above),
Scale.color_discrete(merit_colors),
Guide.xlabel(nothing),
Scale.y_continuous(format=:plain),
Guide.title(“Won More Than 100 MRT”),
Guide.xticks(ticks=nothing))
draw(PNG(“100MRT.png”,4inch, 3inch, dpi=300), p100)
[/code]
I’m just going to post the code without too much commentary. The interesting bits the merit_colors function which selects the Merit blue color as the first color. I used another array called Ls to control the labels of the bars in the chart because using the Winners array didn’t work because of type conversion errors. The other tricky thing to learn was how to modify the spacing between the bars, which ended up as a property of the theme as the bar_spacing parameter.
Other than figuring out the colors, labels, and bar_spacing, it was pretty straightforward. I hope this helps others trying to generate Bar Chars using Julia.